Monitoring Node.js: Watch Your Event Loop Lag!
Event loop lag is an essential, but often overlooked performance metric for Node.js applications. What is it and why does it matter?
If you ask any Node.js developer for their number one performance tip, chances are close to a hundred percent that they will give you the following advice:
Avoid synchronous work.
Why is synchronous work bad? Because in Node.js, there is only a single thread. If you keep that single thread busy with long running operations you prevent it from doing anything else. In a web server scenario this would mean that as long as the thread is busy you would not be able to react to any incoming requests. And as a result:
Every second your code does synchronous work is a second you add to your web server’s response time.
So I guess we can agree that synchronous == bad. The problem is that typically, you don’t know if there is synchronous code in your application. You only realize that something is fishy when your application’s performance starts degrading. One advice that many Node.js devs would give you in this situation is to start profiling and flame graphing your app. While profiling is indeed a great way to find the needle in the haystack I would argue that it should be the last resort as the process is difficult and time consuming. Furthermore, profiling is usually what you do once the damage is done and it’s too late.
With this in mind you might be wondering: wouldn’t it be great to have a continuous measure for synchronous work? A concrete numeric value that you can plot in a line chart? A metric based on which we can trigger an alert once it reaches a threshold? Luckily, that metric exists: It’s called event loop lag.
Note: For this article, a basic understanding of how the Node.js event loop works is required. Since you’ve made it until this point I’m assuming that you know the basics of Node.js, its single threaded nature and that you understand what setTimeout does. If you’re unsure the official docs do a pretty good job at explaining everything you need to know to follow this article.
What is event loop lag?
To make a long story short:
Event loop lag measures the time span between the scheduling of a callback and its execution
Or, since a picture says more than a thousand words:
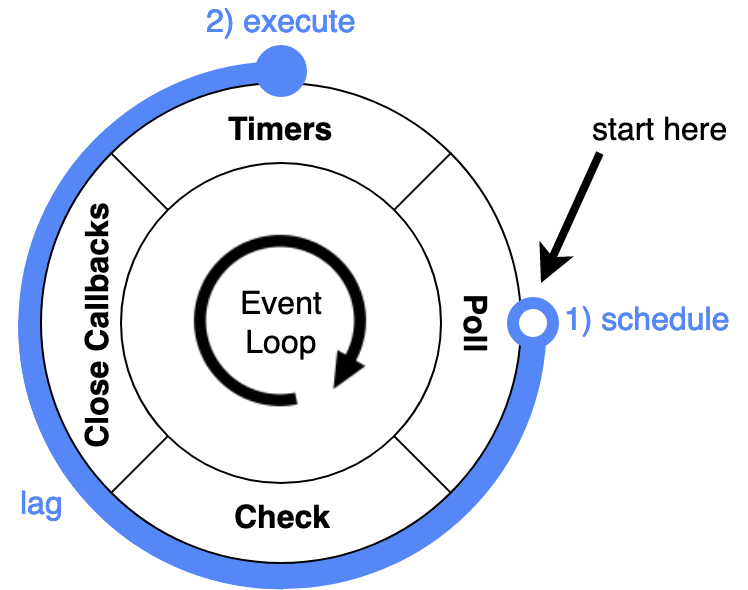
What exactly happens in the time between the scheduling of a callback with, say setTimeout(fn, 0), and the execution of fn? Well, the event loop proceeds its current iteration until it reaches the next timer phase and runs any code that happen to be squeezed in between (the blue circle in the image above). When I say “code squeezed in between” what I actually mean is “your own synchronous code”. So by measuring the time between scheduling and execution we actually measure how much time our own code consumes in a single event loop iteration (roughly).
The longer an iteration takes the more synchronous work is done and the slower the application becomes.
Time for some experiments!
Now that we got the theory covered let’s find out how to measure event loop lag. Of course we could just install a package from npm to do it for us or use the official monitorEventLoopDelay but where’s the fun in that?
Let’s implement it because I’m sure it will help you gain a deeper understanding (and because it would make for a nice exercise in a coding interview 😉)
const start = new Date()
setTimeout(() => {
  const lag = new Date() - start
  console.log(`Lag: \t${lag} ms`)
})
Simple, right? Here’s what’s happening in detail:
- First, we get the current time. This happens in the current execution phase.
- Then, we push a timer callback in the callback queue. The callback will be executed in the future (in the upcoming timer phase to be precise). Within the callback, we simply calculate the difference between the first time measurement and now. The measured value is the event loop lag.
Here’s the output:
Lag: 2 ms
The output shows us that event loop lag was roughly two milliseconds.
Note: For a more precise measurement we could use process.hrtime() instead of Date.
Make it loop!
Of course, the snippet above isn’t of much use as it only measures the lag once at process start. To get a continuous stream of measurements let’s make it loop:
function measureLag(iteration) {
  const start = new Date()
  setTimeout(() => {
    const lag = new Date() - start
    console.log(`Loop ${iteration} took\t${lag} ms`)
    measureLag(iteration + 1) // Recurse
  })
}
measureLag(1)
Notice that we run measureLag recursively, but in a non-blocking manner. Upon each call, measureLag puts another callback of itself in the callback queue. By putting it in the queue (as opposed to just running it directly) we allow the event loop to continue looping and thus prevent the main thread from blocking.
As a result, the console.log is called exactly once per event loop iteration (within each timer phase to be exact). Effectively, what we measure is the execution time of each event loop iteration.
Let’s run it:
Loop 1 took   1 ms
Loop 2 took   2 ms
Loop 3 took   1 ms
Loop 4 took   1 ms
Loop 5 took   2 ms
Loop 6 took   1 ms
Loop 7 took   1 ms
Loop 8 took   2 ms
Loop 9 took   1 ms
Loop 10 took  1 ms
...
Each line of the output corresponds to the execution time of a single event loop iteration. The first iteration took 1 ms, the second iteration took 2 ms, etc…
Make it interesting!
In its current state, the program doesn’t do much. Let’s make it a bit more interesting and let the program do a bit of work. A good example to demonstrate how work affects the event loop lag is hashing. We’re not going to write our own hash function but use an existing one from npm. One of the more popular ones is bcryptjs. We’ll modify the program to continuously calculate hashes in a loop:
// Same lag measuring as before
// ...

const bcrypt = require("bcryptjs")

function hash() {
  const start = new Date()
  const hashRounds = 10 // The more hash rounds the longer hashing takes
  bcrypt.hash("hash me!", hashRounds, () => {
    console.log(`--------- Hashing took ${new Date() - start} ms`)
    setTimeout(hash)
  });
}
hash()
You don’t have to understand every detail of the code. It suffices to understand that we calculate hashes (a computationally expensive operation) in a non-blocking loop using the same setTimeout technique as seen in the previous example. Upon each hash completion we print Hashing took X ms and schedule another hash calculation for the next event loop iteration.
Let’s run it:
Loop 1 took   8 ms
Loop 2 took   1 ms
Loop 3 took   98 ms
--------- Hashing took 95 ms
Loop 4 took   0 ms
Loop 5 took   1 ms
Loop 6 took   0 ms
Loop 7 took   78 ms
--------- Hashing took 79 ms
Loop 8 took   2 ms
Loop 9 took   79 ms
--------- Hashing took 79 ms
Loop 10 took  2 ms
Loop 11 took  78 ms
...
Uh-oh! That doesn’t look too good.
As we can tell from the output some loop iterations exhibit minimal lag and others suffer from massive lag. Notice how the large lag numbers correlate with the hash function’s computation time: 98 ms → 95 ms, 78 ms → 79 ms, etc. The only conclusion we can draw from this is that the hash function performs synchronous work without giving the event loop a chance to iterate. In other words, the hash function blocks the main thread for as long as it is being calculated. As a reminder: while the main thread is busy no other tasks can be performed by Node.js. Neither can it react to expired timeouts nor can it react to I/O events (i.e. serve other requests). In effect, an average lag of 100 ms corresponds to an average 100 ms increase in a web server’s response time. What makes matters worse is that we chose a comparatively weak hash function in this example. A secure hash function should take a lot more than 100 ms to calculate, so the effect would be even more severe in in a real life scenario.
Another thing to note is that even though we run the hash function in an asynchronous fashion (by passing it a callback) the main thread is still being blocked. Thus, asynchronous code does not equal non-blocking code. Those are two different things which are all too often mixed up. You can pass callbacks all you want but as long as the code inbetween is synchronous you’re still blocking.
Note: Looking at the output above, the attentive reader might be wondering why some of the loops are “skipped”. Shouldn’t the hashing consume every iteration? In theory you are right but the reason why this is not the case here lies in the implementation details of the library. bcrypt does some non-blocking, preparatory work before the actual hashing begins in which the event loop may iterate.
Make it fast!
So, we’ve seen that our hashing library (bcryptjs) is unsuitable for a web server use case as it might degrade our application’s performance significantly by doing work in the main thread. What better alternatives are there?
Let’s try to replace bcryptjs with bcrypt (without “js”). It implements the same hash function but the name indicates a major difference between the two libraries: While bcryptjs is written in Javascript, bcrypt is written in C++. This is made possible by Node.js’ C++ API which allows developers to leave the Javascript/Node.js world and do… well, C++ stuff, like for example multi threading.
Note: The point of this example is not to demonstrate that C++ is faster than Javascript (duh) but rather that Node.js allows you to write code in two ways: the right way and the wrong way.
Let’s switch the libraries, then. Since bcrypt and bcryptjs share the same API we can simply replace
const bcrypt = require("bcryptjs")
with
const bcrypt = require("bcrypt")
and run the program once more:
Loop 2 took	1 ms
Loop 3 took	1 ms
Loop 4 took	2 ms
Loop 5 took	1 ms
Loop 6 took	1 ms
Loop 7 took	1 ms
Loop 8 took	1 ms
...
... many more "empty" loops
...
Loop 45 took	1 ms
Loop 46 took	2 ms
Loop 47 took	1 ms
Loop 48 took	1 ms
Loop 49 took	1 ms
Loop 50 took	2 ms
--------- Hashing took 91 ms
Loop 51 took	0 ms
Loop 52 took	1 ms
Loop 53 took	2 ms
...
Now that looks good!
As we can see in the output, switching the library fixed our problem entirely. The event loop lag stayed low consistently, so virtually no blocking could be observed. The first hash was completed after 91 ms – by the time it was completed the loop had iterated 50 times. The explanation is simple: the calculation of hashes has moved entirely to another thread. In the meantime, Node.js could attend to things that it’s good at, like serving requests, or mindlessly looping through the event loop, measuring event loop lag 🤡
Note: I omitted the first line in the output because of an outlier lag spike in the beginning. The spike occurs when we load the bcrypt module, i.e. only once in the beginning. Leaving the first line in would have only added confusion.
Where to go from here?
In this blog post you’ve learned what event loop lag is, how it affects performance and why you should include this metric in your performance monitoring dashboards (if you haven’t already). Event loop lag has an immediate effect on your server’s performance as it is a strong indicator for synchronous work in your main thread.
The larger the event loop lag value is the more synchronous work is done. As demonstrated in the examples, Node.js has a default lag value in the single digit region (1–2 ms) when the application contains no logic at all. Take that as a baseline and try to get your application’s event loop lag into that region. Of course this guideline is hardly realistic (since you typically have logic in your application 😉), but the smaller the value the better. As an advice: anything above ~30 ms is worth investigating and values larger than ~100 ms should definitely make you worried.
If your server is suffering from high lag check your code for synchronous logic (also check your libraries!) and move those parts to another thread using worker threads or extract the concerned code into a separate C++ Addon entirely. When you reach this point, however, you should probably think about rewriting your application in another language 😉